Line name: Xla.Tg(slurp1l:eGFP)Mohun
Synonyms: LURP1:EGFP
RRID: EXRC_0024
EXRC line: Line #24
Non-standard MTA required: No
Transgene description: 5 kb of promoter of the X. laevis LURP-1 gene driving expression of EGFP.
Phenotype: GFP expression in embryonic macrophages (as well as definitive myeloid blood cell population, restricted neural expression, epidermis after stage 49).
Source lab: Mohun lab
Publication: Smith, S., et. al. (2002) “XPOX2-peroxidase expression and the XLURP-1 promoter reveal the site of embryonic myeloid cell development in Xenopus”. Mech of Dev. 117 173–186.
Species: X. laevis
Available as live animals
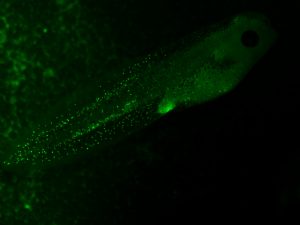
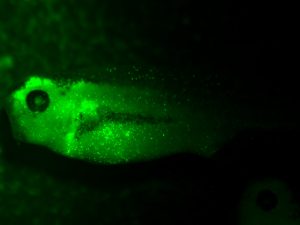
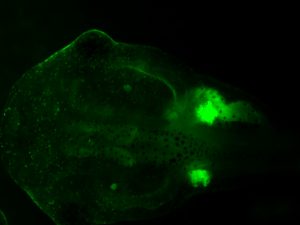
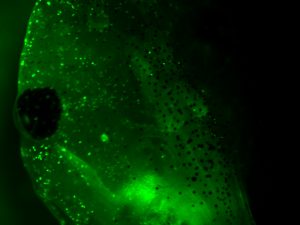
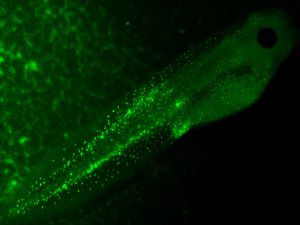
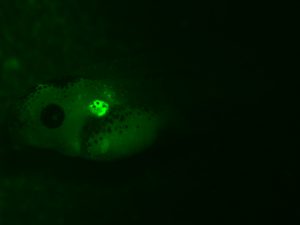
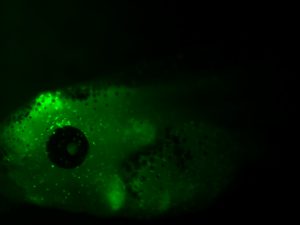
Fig. 1. Macrophage expression of the LURP1::EGFP transgenic line of Xenopus laevis.
A-D: The onset of fluorescence from the LURP1::EGFP transgene reveals the differentiation and dispersal of embryonic macrophages from an anterior ventral domain of the tailbud stage embryo. A, B: Left-lateral and ventral views of a stage 24 embryo. C, D: Left-lateral and a detail view of a stage 28 embryo.
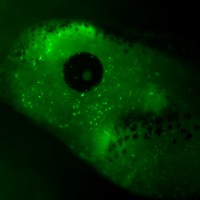
E-H: The widespread distribution of macrophages and the locations of myeloid cell production in growing larvae. E, F: Left and right-lateral views of a stage 43 tadpole showing bright EGFP fluorescence in the major haematopoietic organs, the liver, pronephros and spleen. Additionally, hundreds of punctate, peripherally located macrophages are detected throughout all tissues of this transgenic animal. G: Dorsal view of the same tadpole. H: Detail view showing the concentration of macrophages within the tail. In this transgenic line, the LURP1 promoter also produces expression within a region of the tadpole hindbrain (E-G). M, myeloid domain of embryonic macrophage differentiation; L, liver; PN, pronephros; SP, spleen; HB, hindbrain.
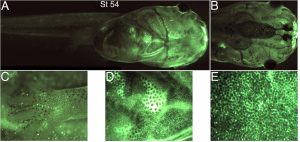
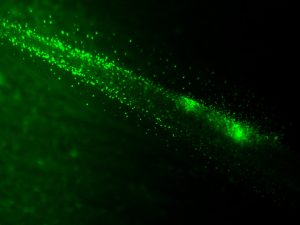
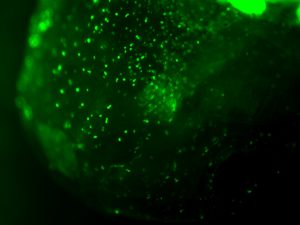
Fig. 2. Fluorescence of the LURP1::EGFP line during late stages of larval development.
A, B: Right ventral-lateral and dorsal-lateral views showing the bright EGFP signal of a stage 54 larva.
C-E: Views of the right hindlimb (C), right trunk (D) and a detail view of the trunk (E), with punctate fluorescence denoting tissue-resident macrophages. At this late stage of development, fainter fluorescence is also found in a lattice-like pattern in the epidermis, which perhaps results from the gradual accumulation of stable green fluorescent protein from macrophages to extracellular compartments of the skin.
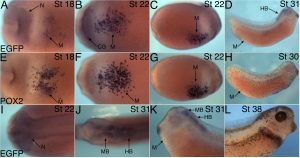
Fig. 3. Detection of the LURP1::EGFP transgene by in situ RNA hybridization.
A-D: A series of transgenic embryos reveals that EGFP RNA can be detected within the anterior ventral, myeloid domain as early as stage 18. A: Ventral view of the anterior portion of a stage 18 embryo. B, C: Anterior ventral portion and right lateral view of a stage 22 embryo. D: Right lateral view of a stage 31 tadpole. EGFP RNA expression is detected in embryonic macrophages and also the brain, which is consistent with the fluorescence signals observed in this transgenic line.
E-H: Sibling transgenic embryos after in situ RNA hybridization for the myeloid peroxidase POX2, which is the earliest and strongest marker of the dispersing embryonic macrophages. E: Anterior ventral portion of a stage 18 embryo. F, G: Anterior ventral portion and right lateral view of a stage 22 embryo. H: Right lateral view of a stage 30 embryo.
I-L: The neural pattern of EGFP expression becomes increasingly restricted as development proceeds. I: Dorsal view of the head of the stage 22 embryo with diffuse transgene expression in the brain. J, K: Dorsal and left lateral views of the head of the stage 31 tadpole show that EGFP-expressing cells are becoming restricted to four compartments along the anterior-posterior axis of the developing brain. L: At stage 38, a right lateral view of the head shows EGFP expression in one compartment only, close to the mid/hindbrain boundary. This tadpole has visible pigment cells while the other tadpoles presented were treated to inhibit melanocyte pigment formation. M, embryonic macrophage; N, neural tissue; CG, cement gland; HB, hindbrain; MB, midbrain.[/vc_column_text][vc_column_text]Copyright Feb 19th 2008
Stuart Smith asserts his writes as the owner of each of the images and movies described below.
The MLC1v::EGFP images have been published previously so Developmental Dynamics holds the copyright.
The dark field images that portray the fluorescence signal from GFP have had their input/output levels for the red, green and blue colour channels adjusted individually in Adobe Photoshop. This approach enables the silhouette of the animal to be observed more clearly, while giving the EGFP fluorescence a false, blue-green colour.
Line information can also be found in Xenbase.
