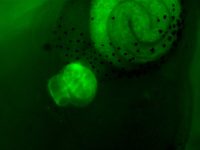
Line name: Xla.Tg(myl2:GFP)Mohun
Synonyms: MLC2:GFP
RRID: EXRC_0020
EXRC line: #20
MLC2 Promoter Sequence
MLC2 Promoter-AY219706 Sequence
Non-standard MTA required: No
Transgene description: 3 kb of promoter of the X. laevis MLC2 (myosin light chain) gene driving expression of GFP
Phenotype: GFP expression in heart precursor
Source lab: Mohun lab
Publication: Latinkic, B. et al (2004) “Transcriptional regulation of the cardiac-specific MLC2 gene during Xenopus embryonic development”, Dev. 131, 669-679
Species: X. laevis
Available as live animals
Fig 1, Cardiac-restricted expression of the MLC2::GFP transgenic line of Xenopus laevis.
A-E: The onset of cardiac fluorescence in a MLC2::GFP embryo can be detected faintly at stage 31 and is then more easily observed during heart looping stages. A: Ventral view of the heart-forming region at stage 31, anterior is to the top. B: Stage 33. C: Stage 36. D: Stage 41. E: Stage 46. F-I: Left lateral views showing the early detection of GFP in the heart. F, G: Bright field view and detail view of fluorescence at stage 31. H, I: Comparable images at stage 33.
J-N: The GFP emission is restricted solely to the heart myocardium and is absent from all skeletal and smooth muscle. Images taken at stage 46. J, K: Bright field and fluorescence images of a left lateral view of the tadpole head and trunk. L: Left lateral detail of heart fluorescence. M, N: Bright field and fluorescence images of the ventral trunk. All images presented are of the same transgenic animal. H, heart; OT, outflow tract; A, atria; V, ventricle.
Fig 2, Cardiac expression of the MLC2::GFP transgenic line during larval development.
A-D: Detail ventral views of GFP fluorescence in the beating heart during larval stages. A: Stage 45. B: Stage 48. C: Stage 50. D: Stage 53. The GFP signal intensity increases in brightness to stage 48, but then Xanthophore pigment cells migrate over the pericardium to obscure the heart myocardium. The yellow sphere to the right posterior side of the heart is the gall bladder.
E-H: Fluorescence images of the ventral head and trunk at the same stages.
I-L: Bright field images of the ventral head and trunk. H, heart.
Copyright Feb 19th 2008
Stuart Smith asserts his rights as the owner of each of the images and movies described below (simply because I haven’t published any of them elsewhere).
The dark field images that portray the fluorescence signal from GFP have had their input/output levels for the red, green and blue colour channels adjusted individually in Adobe Photoshop. This approach enables the silhouette of the animal to be observed more clearly, while giving the EGFP fluorescence a false, blue-green colour.
Line information can also be found in Xenbase.


